Related Articles
- Beyond Chatbots: Unexpected Ways AI Can Enhance Enterprise Mobile Productivity

- Discover How AI is Powering Global Enterprises Bringing in Measurable Digital Transformation
- Discover how AI is Personalizing Medicine and Patient Care
- How AI and Large Language Models (LLMs) are Reshaping the Healthcare Sector
- Integrating AI and IoT in Supply Chains: A Blueprint for Future-Ready Operations
Beyond Monitoring - How Open Standards Make Observability Easier
Modern applications are no longer static code running on servers—they’re dynamic, distributed systems with countless moving parts. Traditional monitoring can tell you when something breaks, but it rarely explains why. That’s where observability comes in.
Observability is the ability to understand the internal state of your systems by analyzing the data they emit—logs, metrics, and traces—so you can move from reacting to outages to predicting and preventing them. And with open standards like OpenTelemetry (OTel), building an observability stack that’s powerful, flexible, and vendor-neutral has never been more achievable. That is, only if you avoid common pitfalls.
Here’s a practical blog for technical leaders, architects, and tech professionals on setting up OpenTelemetry the right way for your observability stack.
Why Observability?
Imagine being able to observe, not just that something broke—but why and where it happened, even in complex microservices and cloud environments. That’s what observability brings: a “flight recorder” for your distributed apps, powered by traces, metrics, and logs of data.
OpenTelemetry (OTEL) is a free, open-source toolkit that enables you to collect this crucial data. It has quickly become the industry standard for instrumenting code, integrating with leading tools like Jaeger (for tracing), Prometheus (for metrics), and Grafana (for dashboards).
Observing what’s happening under the hood is highly insightful, but achieving true observability with OpenTelemetry depends on avoiding a few key mistakes. Here are the most common ones that teams make and how you can avoid them by achieving true observability.
Five Common Mistakes That Hinder OTEL Performance
1. Trying to Observe Everything, Everywhere, Immediately
Teams can sometimes get excited and try to instrument every service and endpoint from day one. But the result of turning on all the taps at once is that you risk drowning in a sea of data. It may lead to systems slow down, and the noise makes real insights harder to spot. Start with your most important user paths; expand as you learn.
2. Missing Connections in the Data
Obvious points like web requests are easier to track, but issues can also lurk in background jobs or message queues. If you miss instrumenting these, your traces are missing links—making troubleshooting slow and frustrating. Ensure your OTEL context passes through all components, even “behind-the-scenes” ones.
3. Bad Sampling or No Data Management Strategy
Collecting random samples of data without a plan can mean missing rare but costly problems. Not setting rules for data retention leads to high storage bills or compliance issues. The team must decide which events matter most, how much data should be kept, and for how long. Use sampling settings and storage tiers wisely.
4. Using Collector Defaults Without Tuning
The OTEL Collector is the “central station” that gathers and forwards your tracking data to storage and visualization tools. However, if left on defaults, it may become a bottleneck or even drop data when under heavy load. Adjust memory, batch sizes, and timeouts to match your environment. Monitor and tweak as usage grows.
5. Skipping Security and Privacy Checks
Telemetry can sometimes carry sensitive data. Failing to add safeguards could result in unintentional leaks. Always set up encryption, manage who can access telemetry, and scrub or mask confidential information right from the source.
Want to dive deeper into real-world strategies for implementing OpenTelemetry and avoiding these pitfalls? Join our upcoming webinar where industry experts share hands-on guidance on building a scalable observability practice with open standards.
Register Now
Pro Tips for a Smooth Observability Journey
Bundle and Compress: Try to group telemetry data before sending to minimize bandwidth and processing.
Monitor Overhead: Especially during rollouts, keep an eye on system resource use due to OTEL.
Plan for Failures: Set up “safe modes” or fallbacks if the observability backend goes offline.
Iterate Slowly: Begin with less critical services; tune and expand thoughtfully.
That is how you maintain a modern observability stack.
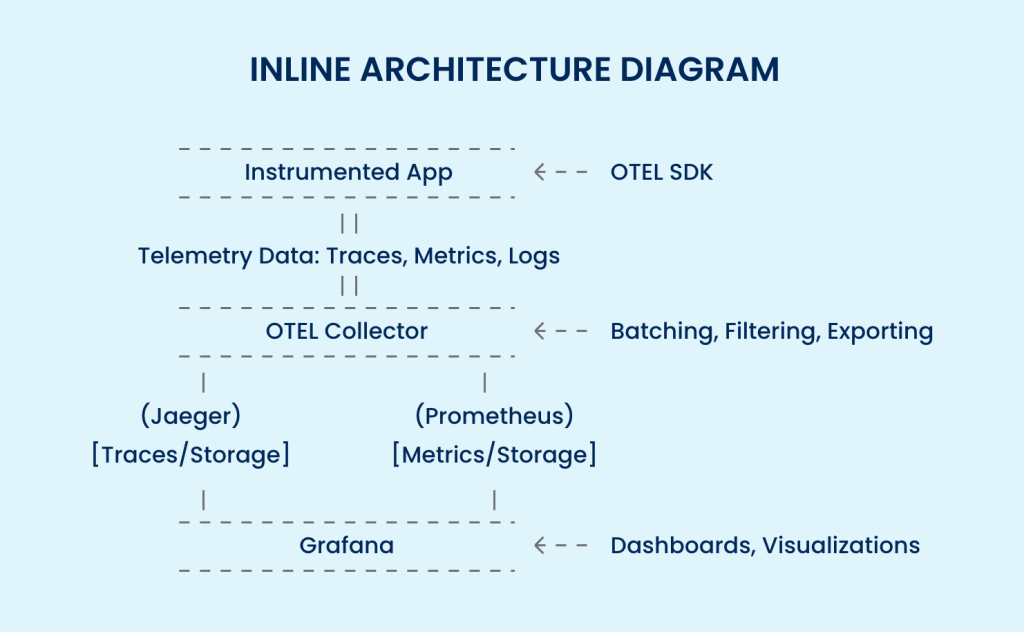
How Does It All Work Together?
Your App: Uses OTEL to track what’s happening—think of it as narrating its own story.
The Collector: Gathers the stories, makes sure they’re well-packaged, and ships them off. It’s like an editor and post office in one.
Jaeger (for tracing): Stores and lets you search for these stories—so you can track where things went wrong or right.
Grafana: Turns all the data into visual dashboards—charts, graphs, and timelines, so everyone (tech or non-tech) can see what’s happening at a glance.
Conclusion
Adopting OpenTelemetry may seem technical, but its fundamental purpose is simple: help enterprises see what’s going on so that you can run better software and delight your users. The key is to be focused, connect all the dots, manage your data wisely, and keep privacy front and center, always.
Do this, and observability becomes your silent partner, not just for tech pros, but for the whole business.
Ready to take the next step in your observability journey? Don’t just read about best practices; see them in action. Join our live webinar to learn how experts are using OpenTelemetry to build reliable, scalable observability stacks.

